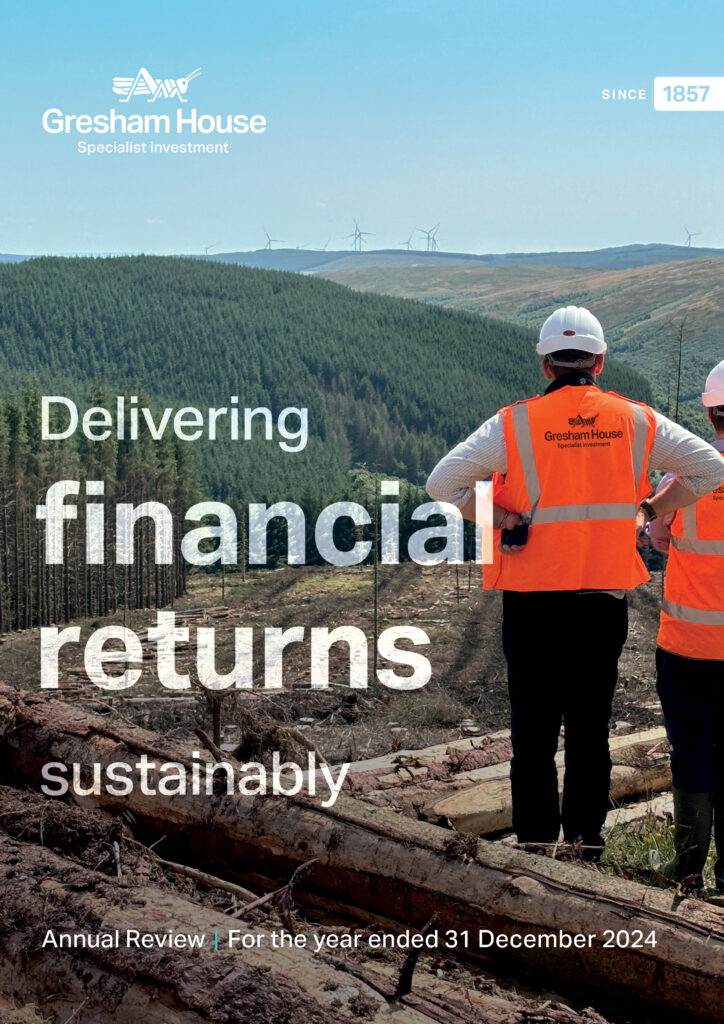
for the year ended 31 December 2024
for the year ended 31 December 2024
Delivering financial returns sustainably
The macroeconomic and geopolitical changes evident globally are affecting investment decision making by many LPs. Despite this, allocations to our real asset and strategic equity platforms continue to grow.
There is building recognition that strong investment returns need not be compromised by investing into sustainable investment themes. The additional portfolio benefits from diversification, inflation linkage, lower relative volatility plus non-financial additionality make the asset classes where Gresham House invests highly valuable.
We are excited by the pipeline of opportunities set to develop in 2025 and beyond and the solutions we can offer clients across real assets and private equity.
⬇️ Download the report
Executing on our growth strategy
We were pleased to see continued momentum in 2024, despite the global slowdown in fundraising, and our business has a well-defined strategy and a clear pathway for growth within our asset classes.
Financial highlights
|
|
|
|
|
|
Sustainability highlights
The sustainable investment landscape is evolving at pace, driven by regulatory developments, investor expectations, and the urgency of addressing climate and biodiversity challenges. Our Corporate Sustainability strategy ensures we remain at the forefront of these changes, integrating sustainability into our investments, operations and corporate culture and to focus on generating additionality.
|
|
|
|
|
|
Leading the way in areas of growing asset allocation
Gresham House has a rich heritage as one of the oldest companies in the UK still operating today, having first been incorporated in 1857 with company number 871.
Today, we have significant global and regional market positions across a number of asset areas including:
|
|
|
|
|
Chief Executive, Tony Dalwood said:
 |
“We remain ambitious and confident that Gresham House will continue to drive the delivery of its financial and strategic goals with an unwavering focus on investment performance. We continue in our aim to scale internationally and through the creation of new solutions for clients, particularly in natural capital, forestry and infrastructure.
“As we seek to internationalise our investment offering, we have set out our Value Creation Plan to deliver our strategic plan, GH30, to drive AUM to £20 billion by 2030 and increase revenues to £200 million through organic and acquisitive growth.” |
1. Assets Under Management is defined as the fee earning value of assets managed and advised by Gresham House.
2. EBITDA metric excludes interest and financing costs, depreciation and amortisation, exceptional items from acquisition costs and restructuring and acquisition-related remuneration.
3. Net core income includes asset management income, performance fees and dividend and interest income earned in the year.
4. ROCE is defined as EBITDA plus net realised gains and development activity and fair value movements in investments, less fair value movement in contingent consideration, divided by opening net assets, adjusted for any shares issued in the year.
5. EBITDA margin is defined as net core income divided by EBITDA.
6. IPE Real Assets 2025 by value
 Gresham House
Specialist asset management


